
Infrastructures and application environments are becoming increasingly complex. This requires to keep an eye on everything and to make sure that we can easily automate the reactions in case of failures. In this article, we will try to discuss some solutions that allow us to have a global vision of all our elements, whether physical or cloud. Review of trendy products.
An eye....on everything!
Monitoring or supervision of infrastructures consists of being able to control the proper functioning of IT solutions in a company or operating environment. To carry out this type of monitoring, there are standards in the IT world (both in network protocols and in operating systems). These standards will allow us to collect usage data in real time and to notify administrators about the general state. Subsequently, automatic rules will be established to solve known or recurring problems in order to facilitate centralized management.

First of all, it is necessary to understand how the monitoring actions are defined on the source elements (i.e. on machines or applications). Each element to be monitored has access via a protocol (e.g. SNMP or WMI) and with identity management, with administration rights (or also called administration profile). For example, SNMP allows, by means of an exchange definition, either to read a status or to interact with the object being monitored.
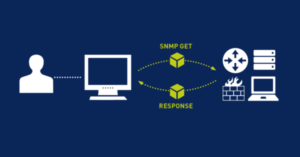
These network protocols, dedicated to monitoring, should be seen as a means of accessing information on the operating status. For example, if a machine is no longer present on the network (or considered to be switched off), we will try to test its presence (PING and ICMP response), and depending on the result, we will inform the environment administrator of the situation. We can also query Windows, through WMI, and ask it, with the right user and the necessary rights, to tell us if a certain application or service is working or stopped. All these situations can be applied and checked, by different means (protocols) or with the installation of agents (specific mini-programs of control), which will relay either in real time or at programmed times.
There are many existing tools in this field. There are various sites that list these tools, for example: https://www.monitoring-fr.org
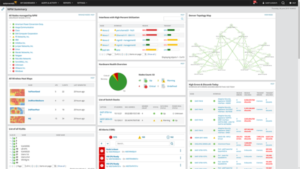
Let us start with a series of tools. The first is PRTG. The company Paessler, which offers this solution, has developed a monitoring platform, running under Windows. It is possible to manage both physical components and applications of all kinds via standard administration protocols.
To get an idea, here is an introductory video:
In the same trend under Windows servers, there is also the ManageEngine OpManager solution. The product is available in various versions (free for the basic module and paid versions for extended support, with additional functions).
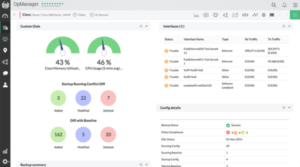
Here is a video to introduce the product:
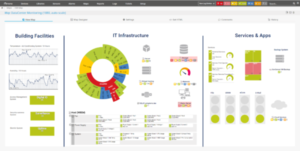
Also very popular, SolarWinds solutions offer advanced monitoring management, with rich interfaces.
Introductory video (in English):
The main disadvantage of these solutions lies in the fact that a Windows server must be dedicated to the task of supervision (which can be considered a heavy solution, depending on the environment). This leads us to use or consider products that can work in containment systems.
Let's move on to a solution that can run on Linux: here is Zabbix, a web-based administration that can perform network analysis to discover the elements to be monitored, with the possibility of connecting to APIs to analyse the operation of applications (on premise or in SaaS). Here is a video on the implementation in a LXC:
As you can see, the initial set-up can be done very quickly and allows for centralized management of the solutions.
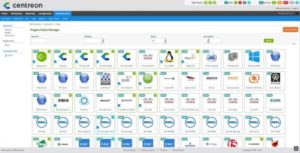
There are a lot of possibilities in the open source world. To name a few: Nagios, NetData (these two are based on Linux and can run in containers, like Zabbix). There is also ZenOss, or Centreon, which is available with commercial offers.
The configuration work is more substantial, depending on the complexity of the infrastructure to be monitored or the management rules you wish to put in place. It is recommended to plan and establish the management concepts before choosing the appropriate tool and starting its implementation.
It may also be that in some cases it is necessary to use several monitoring tools to manage all the operational cases. And this can sometimes lead to a loss of control of the whole. In this case, it is necessary to rely on what are called information aggregators for supervision.
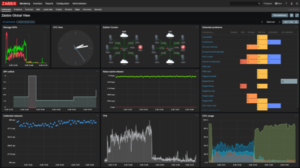
This is the mission of a solution like Grafana.

Allowing you to manage various data sources simultaneously, analyse them and create rich dashboards, Grafana also allows you to automate fault resolution processes or do advanced notification for administrators. Here is the video from their 2019 conference, which shows the use of the console and the creation of Dashboards in Grafana:
In short...it's controlled?
As you can see, the number of existing products is quite substantial. The difficulty in finding your way through the jungle of solutions on offer is to have a clear idea of what you need to monitor, how much time you can devote to it and how you want to automate the recovery process in the event of a system failure. This is called a disaster recovery plan (DRP). It is important to rely on monitoring tools, to gain responsiveness and to enable rapid identification of problems. The analysis of the need requires the support of professionals in the field, who will be able to understand and analyse your situation and propose the right alternatives.
Author: Michel Aguilera
We share your challenges, we accompany your changes
If you have a question or a suggestion, we are at your disposal to answer it by email or by phone.
