


Monitoring, tools to supervise your infrastructures and applications

Infrastructures and application environments are becoming increasingly complex. This requires the ability to keep an eye on the big picture and ensure that responses can be easily automated in the event of failures. In this article, we’ll explore a few solutions that provide this comprehensive view of all our components, whether physical or cloud. A roundup of trending products.
An eye....on everything!
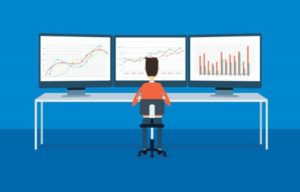
Monitoring or supervision of infrastructures consists of being able to control the proper functioning of IT solutions in a company or operating environment. To carry out this type of monitoring, there are standards in the IT world (both in network protocols and in operating systems). These standards will allow us to collect usage data in real time and to notify administrators about the general state. Subsequently, automatic rules will be established to solve known or recurring problems in order to facilitate centralized management.
First of all, it is necessary to understand how the monitoring actions are defined on the source elements (i.e. on machines or applications). Each element to be monitored has access via a protocol (e.g. SNMP or WMI) and with identity management, with administration rights (or also called administration profile). For example, SNMP allows, by means of an exchange definition, either to read a status or to interact with the object being monitored.
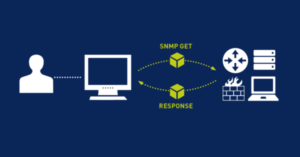
These network protocols, designed for monitoring, should be viewed as means of accessing information about operational status. For example, if a machine is no longer present on the network (or is considered to be turned off), we will attempt to check for its presence (using PING and the ICMP response), and depending on the result, we will notify the environment administrator of the situation. We can also query Windowsthe system via WMI and ask it—using the appropriate user account and necessary permissions—to tell us whether a particular application or service is running or has stopped. All of these scenarios can be implemented and verified using various methods (protocols) or by installing agents (small programs designed for specific monitoring tasks), which report back either in real time or at scheduled intervals.
There are many existing tools in this field. Various websites list these tools, such as:https://www.monitoring-fr.org
Let’s start with a series of tools. The first isPRTG. Paessler, the company behind this solution, has developed a monitoring platform that runs on Windows. Using standard management protocols, it is possible to manage both physical components and applications of all kinds.
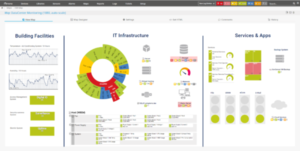
To get an idea, here is an introductory video:
In the same category of server software Windows, there is alsoManageEngine's OpManager solution. The product is available in various versions (a free version for the basic module and paid versions for extended support, with additional features).
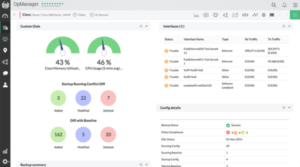
Here is a video to introduce the product:
Also very popular, SolarWinds solutions offer advanced monitoring management, with rich interfaces.
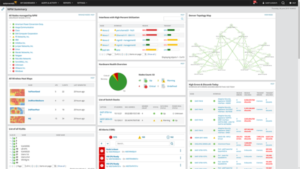
Introductory video (in English):
The main drawback of these solutions is that a server must be dedicated Windowsfor the monitoring task (which may be considered a resource-intensive solution, depending on the environment). This leads us to use or consider products that can run incontainerized systems.
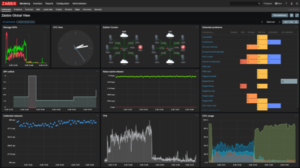
Let's move on to a solution that works on Linux: here'sZabbix, a web-based management tool that can perform network scans to discover components to monitor, and also offers the ability to connect to API to analyze application performance (on-premises or via SaaS). Here’s a video on setting it up in an LXC:
As you can see, the initial set-up can be done very quickly and allows for centralized management of the solutions.
There are a lot of possibilities in the open source world. To name a few: Nagios, NetData (these two are based on Linux and can run in containers, like Zabbix). There is also ZenOss, or Centreon, which is available with commercial offers.
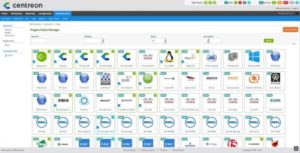
The configuration work is more substantial, depending on the complexity of the infrastructure to be monitored or the management rules you wish to put in place. It is recommended to plan and establish the management concepts before choosing the appropriate tool and starting its implementation.
It may also be that in some cases it is necessary to use several monitoring tools to manage all the operational cases. And this can sometimes lead to a loss of control of the whole. In this case, it is necessary to rely on what are called information aggregators for supervision.
This is the mission of a solution like Grafana.
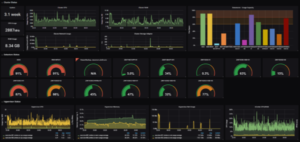
Allowing you to manage various data sources simultaneously, analyse them and create rich dashboards, Grafana also allows you to automate fault resolution processes or do advanced notification for administrators. Here is the video from their 2019 conference, which shows the use of the console and the creation of Dashboards in Grafana:
In short...it's controlled?
As you may have noticed, there is a fairly large number of products available. The challenge in navigating the jungle of available solutions is having a clear idea of what needs to be monitored, how much time can be devoted to it, and how we want to automate recovery processes in the event of a system failure. This is called aDisaster Recovery Plan (DRP). It’s important to rely on monitoring tools to improve responsiveness and enable rapid problem identification. Analyzing your needs requires consulting industry professionals who can understand and analyze your situation and propose the right solutions.
Author: Michel Aguilera
What an article Can't Know
An article describes what applies to everyone. What varies from one organization to another is the inventory: which applications, which accounts, and which pieces of equipment are actually involved in your organization. The inventory determines the scope of the effort, and it cannot be summarized on a single page.
You'll be speaking directly with the engineers who will be doing the work, not with a middleman. We'll respond within 24 business hours.
Check what is still true
Announced dates are sometimes postponed, products are renamed, and conditions change. The blog tracks these topics over time: when a rule changes, a new post announces it.
Search for a topic in the blogIn the same issue
Three articles on the same topic. The blog has 139 articles, all of which are freely available.